Tag Archive: State by State


How Much Is Your State Paying For A Gallon Of Gas? This Cool Map Will Show You


Debt.com Gas Prices Over Time


” What is the average price of gas in your state? Researchers at Debt.com have put together a map to show you.

  Debt.com’s interactive map allows users to see their state’s average gas price-simply by hovering their cursor over the state. Clicking a state will show you its average price for the last 10 years:

  While the national average for a gallon of gas is about $2.18, some states fare better or worse than others.

  For example, drivers in Hawaii “consistently pay the most for gas.” They are currently paying an average of $3.31.

  In addition to Hawaii, drivers in Alaska, California and the New England region pay among the highest average gas prices in the nation.”


More at The Daily Signal


The Pentagon Finally Details Its Weapons-For-Cops Giveaway


DoD Weapons Giveaway


Click image and scroll down for an interactive , state by state and 
county by county accounting of the DoD weapons giveaway


” You may have heard that the image-conscious Los Angeles Unified School District chose to return the grenade launchers it received from the Defense Department’s surplus equipment program. You probably have not heard about some of the more obscure beneficiaries of the Pentagon giveaway:

  • Police in Johnston, R.I., with a population less than 29,000, acquired two bomb disposal robots, 10 tactical trucks, 35 assault rifles, more than 100 infrared gun sights and two pairs of footwear designed to protect against explosive mines. The Johnson police department has 67 sworn officers.
  • The parks division of Delaware’s Department of Natural Resources was given 20 M-16 rifles, while the fish and wildlife enforcement division obtained another 20 M-16s, plus eight M-14 rifles and ten .45-caliber automatic pistols.
  • Campus police at the University of Louisiana, Monroe, received 12 M-16s to help protect the 8,811 students there (or perhaps to keep them in line).
  • The warden service of Maine’s Department of Inland Fisheries and Wildlife received a small aircraft, 96 night vision goggles, 67 gun sights and seven M-14 rifles.

  For more than 20 years, the Pentagon program that distributes surplus weapons, aircraft and vehicles to police departments nationwide received little attention or scrutiny. Defense Department officials closely guarded the details of which agencies across the country received which items.

  Then, events in Ferguson propelled the 1033 program, as the surplus distribution is called, into the public eye.”


Total Value of Tactical Items Distributed by Department of Defense 1033 Program


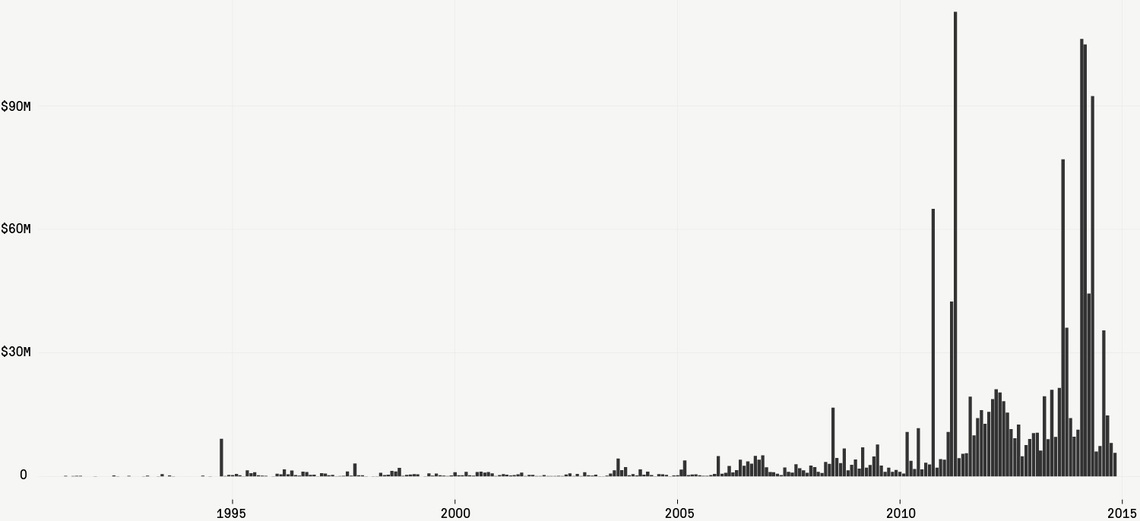
    Readers should take note of when this program really took off … 2010 . It comes as no surprise that this disastrous policy truly came into it’s own during the current administration .


” Flooded with calls for greater transparency, in late November, the Pentagon quietly released data that details all tactical equipment distributed through the program, and for the first time identified the agencies that received items. The data is a national gift list of high-caliber weapons, armored vehicles, aircraft and similar military equipment, all delivered for the price of shipping and often with little civilian oversight.

  The program has doled out $5 billion in equipment since 1990. Most of it was general office and maintenance equipment – shovels, copiers, computers – but the Pentagon largesse included tactical military equipment worth more than $1.4 billion, disseminated in 203,000 transfers to about 7,500 agencies. Even after Ferguson, the program continues to chug along, transferring $28 million in tactical equipment in the past three months.”


     Read the entire accounting and be sure to click the interactive link to see exactly what type of military firepower that your local authorities have received from the Feds .

   See also , The Marshall Project’s companion piece, A Department Of Defense 2014 Gift Guide : 


” Shopping for holiday gifts for your local police department, park ranger or campus security team? How about an “interim fast attack vehicle”? Or a nice grenade launcher? These are just a few of the $5 billion dollars worth of surplus items that the Defense Department has distributed to law enforcement agencies and others in its Excess Property Program, also called the 1033 program. Below is a list of gifts culled from records that the department quietly made public last month. The values are based on what the Pentagon paid when it acquired the equipment. The recipients paid only shipping.”


MRAP Giveaway


God save us from our own government …


This Map Shows The Real Value Of 100 Dollars In Your State


” How far does a dollar go in your state compared to others in the United States? Thanks to the Tax Foundation’s review of Bureau of Economic Analysis data, now you know.

  A dollar doesn’t go quite as far in states like California and New York, and it goes comparatively further in states like Mississippi and South Dakota.

  The cost of living gap is amplified by federal taxes being based on the same income levels regardless of cost of living. Someone who earns $40,000 a year in Jackson, Miss., is taxed at the same federal rate as someone earning $40,000 in San Francisco, Calif.”


Continued


What Are The Online Shopping Habits Of The People In Your State?


ebay1


” Kentuckians really, really love their medical supplies and equipment, while Iowans like their small appliances – at least according to a new infographic compiled by online shopping mecca eBay.

  According to Mashable, eBay analyzed 2013-2014 shopping habits to find the top 500 brands purchased by residents of each state. The online retailer then condensed the data to general categories like “furniture,” “robotic vacuums,” and “batteries” among others.”


Glenn Beck


This GIF Depicting Voter Turnout By State In Presidential Elections Is Cooler Than You’d Expect


” The GIF at the top of this story is fascinating if you enjoy maps, politics or scanning for patterns.

  It depicts voter turnout by state in presidential elections from 1980 to 2012.

 It’s an impressive graphic. It caught my eye on Reddit, and I watched it repeatedly while writing this story. I even took some time and checked the numbers against Census Bureau data to be sure it’s accurate. (Note: the legend is a bit small, but red stands for low turnout and green for high turnout — and the colors are on the spectrum following the ROYGBIV pattern we learned in secondary school.) “


Washington Examiner


One Chart Paints A Startling Picture Of What 36 U.S. States Beat The World At


prison policy


” Approximately 2.2 million adults – that’s one out of every hundred people – in America are currently living behind bars. That’s far and away higher than the next highest country – Cuba – by both sheer number and per capita.

  The Prison Policy Initiative took a look at how individual states would line up if they were treated like actual countries. And the results were very disheartening – 36 states have a higher incarceration rate than every other country in the world.

  This is a startling image of where our country stands in the world, and it leads to several very important questions: Does the United States have a crime problem? A prison problem that costs too much money? No problem at all? “


More here


Half In Illinois And Connecticut Want To Move Elsewhere


Who Wants To Move


” Every state has at least some residents who are looking for greener pastures, but nowhere is the desire to move more prevalent than in Illinois and Connecticut. In both of these states, about half of residents say that if given the chance to move to a different state, they would like to do so. Maryland is a close third, at 47%. By contrast, in Montana, Hawaii, and Maine, just 23% say they would like to relocate. Nearly as few — 24% — feel this way in Oregon, New Hampshire, and Texas.

  These findings are from a 50-state Gallup poll, conducted June-December 2013, which includes at least 600 representative interviews with residents aged 18 and older in each state. Gallup measured residents’ interest in moving out of state by asking, “Regardless of whether you will move, if you had the opportunity, would you like to move to another state, or would you rather remain in your current state?” “


Moving


” Thirty-three percent of residents want to move to another state, according to the average of the 50 state responses. Seventeen states come close to that 50-state average. Another 16 are above the average range, including three showing an especially high desire to move. In fact, in these three — Illinois, Connecticut, and Maryland — roughly as many residents want to leave as want to stay.

  Nevada, Illinois, Maryland, Louisiana, Mississippi, New York, and Connecticut all appear particularly vulnerable to losing population in the coming few years: high percentages of their residents say they would leave if they could, and larger-than-average percentages say they are at least somewhat likely to do so in the coming year. At the other end of the spectrum, Texas, Minnesota, and Maine have little to fear. Residents of these states are among the least likely to want to leave and few are planning to leave in the next 12 months.”


See all the data and more at Gallup.com


MAP: Find Out The Surprising Rankings Of What Your State Is The Worst At


5328a36506558


” Normally we’re seeing maps of how well your state does in any given area or maps having to do with political topics, however this time we’re going to show you what your state is the worst at. Created by Redditor bigafricanhat, this map was compiled using a “variety of sources” but the creator also said that they took some liberties in its creation where states came in dead last in multiple categories.

  Some of the findings may shock you and some will more than likely cause you to say “Well I’m not really surprised,” like Maryland having the most cursing or California being the worst state for business. However there are some that are rather surprising in there, like Alaska having the highest firearm death rate and Louisiana having the highest murder rate (I thought for sure that would have been Illinois and with all the hunters in AK you would think everyone knew about firearm safety).”


See the rest here


Find Out Here


” Last summer, I stumbled across a clever 1993 paper by education statisticians Mark Dynarski and Philip Gleason that proved it was possible to adjust average state SAT scores for variations in the test participation rate and demographic factors, making them comparable to one another. Barely able to contain my excitement (hey, don’t judge), I set about extending their method so that it could discern trends in state SAT scores over time, and improving the validity of its estimates by using more data, fewer assumptions, and more exhaustive methods. Last week, I released the technical paper presenting those extensions. Yesterday, I released a paper that uses them to chart academic achievement and spending trends, for every state, back to 1972. How did your state do? Find out here.”


      As the reader can see from the graph of New York above , while education spending has skyrocketed the concomitant results put the lie to the Liberal mantra of “more spending” . Lest our readers think that NY is an outlier we leave you with another state as further proof that the ever-increasing spending is not benefiting the children …


     The trend is widespread and hardly unique to the northeast . It’s quite simple really . In the past 40 years as education spending has grown exponentially nationwide and our taxes have gone through the roof the benefit to the students has been nil . See where your state stands here courtesy of the Cato Institute .


Cigarette Taxes And Cigarette Smuggling By State


” Public policies often have unintended consequences that outweigh their benefits. One consequence of high state cigarette tax rates has been increased smuggling as criminals procure discounted packs from low-tax states to sell in high-tax states. Growing cigarette tax differentials have made cigarette smuggling both a national problem and a lucrative criminal enterprise.

  Each year, scholars at the Mackinac Center for Public Policy, a Michigan think tank, use a statistical analysis of available data to estimate smuggling rates for each state.[1] Their most recent report uses 2012 data and finds that smuggling rates generally rise in states after they adopt large cigarette tax increases. Smuggling rates have dropped in some states, however, often where neighboring states have higher cigarette tax rates. Table 1 shows the data for each state, comparing 2012 and 2006 smuggling rates and tax changes.”


Top 10 Cigarette Smuggling States


” New York is the highest net importer of smuggled cigarettes, totaling 56.9 percent of the total cigarette market in the state. New York also has the highest state cigarette tax ($4.35 per pack), not counting the local New York City cigarette tax (an additional $1.50 per pack). Smuggling in New York has risen sharply since 2006 (+59 percent), as has the tax rate (+190 percent).”


Read the rest from the Tax Foundation


New York And California Suck For Taxpayers, And For Freedom


Tax Burden Map


” New York and California are the worst and second worst states in terms of tax burden, in what is less than shocking news from the financial website,WalletHub. The ranking tallies annual state and local taxes, and puts the Golden State and the Empire State at the bottom of the heap, with Wyoming and Alaska at the top as the two least burdensome states for taxpapers in a listing that also includes the District of Columbia (number 37, if you’re curious).

  In and of itself, the ranking is helpful—but it’s also helpful to cross-reference the tax ranking with separate rankings of economic liberty and overall freedom to see how they correlate. The result is a handy guide to places to live—or avoid like the plague.

  For its tax rankingsWalletHub compared: real estate tax, state income tax, local income tax, vehicle property tax, vehicle sales tax, sales and use tax, fuel tax, alcohol tax, food tax, and telecom tax.”


    We thought it would be helpful to be able to look at WalletHub’s tax rankings through the red state/blue state prism and as one would expect , with the occasional  outlier the majority of blue states fall in the heavily taxed category . No real surprise to anyone who pays attention , but interesting to see it on the page with actual hard numbers .


Rank State Avg. Annual State & Local Taxes % Difference from National Avg. Adj. Rank (based on Cost of Living Index)
1 Wyoming $2365 -66% 1
2 Alaska $2791 -60% 4
3 Nevada $3370 -52% 2
4 Florida $3648 -48% 3
5 South Dakota $3766 -46% 5
6 Washington $3823 -45% 6
7 Texas $5193 -25% 7
8 Delaware $5195 -25% 12
9 North Dakota $5588 -20% 13
10 Colorado $5674 -18% 14
11 New Mexico $5822 -16% 8
12 Alabama $5846 -16% 9
13 Arizona $6057 -13% 18
14 Utah $6069 -13% 10
15 Mississippi $6210 -11% 11
16 Indiana $6358 -9% 15
17 Louisiana $6373 -8% 16
18 West Virginia $6598 -5% 19
19 Montana $6641 -5% 20
20 Oklahoma $6795 -2% 17
21 Massachusetts $6884 -1% 35
22 Rhode Island $6905 -1% 40
23 South Carolina $7070 +2% 25
24 Georgia $7201 +3% 22
25 Missouri $7220 +4% 23
26 Tennessee $7252 +4% 21
27 Virginia $7333 +5% 29
28 New Hampshire $7419 +6% 41
29 Hawaii $7427 +7% 48
30 Arkansas $7455 +7% 26
31 Kentucky $7472 +7% 24
32 Ohio $7604 +9% 28
33 Kansas $7695 +11% 30
34 North Carolina $7705 +11% 31
35 Idaho $7776 +12% 27
36 Michigan $7867 +13% 32
37 District of Columbia $8034 +15% 46
38 Minnesota $8261 +19% 36
39 Pennsylvania $8344 +20% 34
40 Oregon $8416 +21% 42
41 Maryland $8571 +23% 44
42 Maine $8622 +24% 43
43 Iowa $8788 +27% 33
44 New Jersey $8830 +27% 47
45 Vermont $8838 +27% 45
46 Wisconsin $8975 +29% 39
47 Illinois $9006 +29% 38
48 Connecticut $9099 +31% 49
49 Nebraska $9450 +36% 37
50 California $9509 +37% 50
51 New York $9718 +40% 51


   Read more at Reason where you can see not only the tax rankings but how they correlate to freedom and liberty rankings as well . Spoiler … The red states predominate in liberty too …


The United States Of Income Tax, In One Map


tumblr_n09mr3WwQZ1rasnq9o1_1280

” Ever wondered which state has the highest marginal income tax rate? Or which states have no income tax?

  Thanks to a map from the accounting firm O’Conner Davies, we know the answer to question one is California (13.3 percent) and the answer to question two is Alaska, Washington, Nevada, South Dakota, Texas and Florida and Tennessee (as the map key below indicates, Tennessee does not have an income tax. The six percent rate noted on the map refers to Tennessee’s tax on income from interest and dividends.)”


Read more at the Washington Post


Map: State Unemployment October 2013


 American’s For Prosperity Brings Us This Handy Economic Policy Scorecard


AFP Scorecard


    To see the AFP economic ratings of your Senators and Representatives click on the above graphic and you will be taken to the interactive page where you can view each politician’s economic rating state by state . Below is a sample screenshot of part of the NY delegation and as you can see there is no wonder why the state of New York is in such dire economic straits .


AFP NY Sample


For New Yorkers the above graphic is depressing enough . See if your state is doing any better at AFP Scorecard.


The Bewildering Web Of U.S. Fireworks Laws


Americans who want to light off some fireworks to celebrate this Fourth of July must navigate a confusing set of rules and regulations that vary across state, county and even town lines. Even officially sanctioned fireworks shows can run afoul of the law.

The Fourth of July is almost here. It will be a day of pies, picnics, grills and anticipation of the sky darkening into a perfect backdrop, because there are few things Americans enjoy more than fireworks bursting in air

Plenty of people are busily stocking up on everything for the perfect backyard display: sparklers, bottle rockets, Roman candles, fountains and finales. But every year, some of these backyard pyrotechnic displays run afoul of the law. It’s not hard to do. The laws surrounding fireworks can vary dramatically state by state, county by county and even across town lines. How did things get so confusing?

States’ Rights

Fireworks rules may seem unnecessarily restrictive in some places, but they were much more intense just 50 years ago when several states had full or partial bans of fireworks, Robert Flanagan of Black Cat Fireworks says. “[The states] closed up in the ’30s and ’40s when we didn’t have good regulations.” Fuses, materials and even the amount of explosives in seemingly similar products could vary dramatically. But in the years since, the fireworks industry and the Consumer Products Safety Commission have been working to make fireworks safer and more regulated. According to Julie Heckman, the executive director of the American Pyrotechnics Association, a trade group that represents the industry, many states began loosening their fireworks laws around the year 2000 and continued the trend as they realized how much revenue fireworks taxes could bring to their states

So today the rules run the gamut. Wyoming, for example, complies with federal regulations but makes no special rules at the state level, leaving fireworks regulations up to local governments. Other states, meanwhile, have passed extensive legislation to restrict the ages of people that buy or sell fireworks, or allow fireworks to be sold only on a few days each year (usually around the July 4 or New Year’s Eve). Just four maintain a full ban on consumer fireworks: Massachusetts, New Jersey, New York and Delaware.


Do You Live In A High Beer Tax State ?


HT/Reason


Map Courtesy Of / Tax Foundation


The Firearms Statistics That Gun Control Advocates Don’t Want to See


FBI Gun Stats Show California, Washington, D.C. Rank High in Gun Murders


” To accompany TheBlaze’s coverage of the National Rifle Association’s annual meeting in Houston, we figured it could be helpful to share some gun statistics pointed out to us by some of the NRA Convention attendees. Forget the talking points used by both sides in the gun control debate; we’re going to be talking about verified statistics.

Gun control advocates be advised, these are not the statistics you are looking for.

According to data from the FBI’s uniform crime reports, California had the highest number of gun murders in 2011 with 1,220 — which makes up 68 percent of all murders in the state that year and equates to 3.25 murders per 100,000 people. 

In 2011, Utah, the state that the Brady Campaign determined had the least gun control, experienced just 26 gun murders and a firearms murder rate of 0.97. Utah has a population 2.8 million.”


Read the whole thing .


Cost Of Illegal Immigration At The State Level


” Wondering how illegal immigration is affecting your pocket book? While the fiscal burden of illegal immigration on the United States taxpayerswas estimated at $113 billion in 2010, below you will find links to cost summaries for each separate state so that you can see specifically how this is impacting your state.”


FAIR


Army Lays Out State-By-State Cuts In Report


Military Closings By State


” The Army estimates automatic budget cuts scheduled to take effect March 1 will have a $15 billion economic impact and affect more than 300,000 jobs nationwide, according to documents obtained by USA Today.

Hardest hit states include Texas, Virginia and Pennsylvania. Among the least affected: Delaware, Wyoming, Montana and Rhode Island.

The military faces $500 billion in budget cuts over 10 years from sequestration — automatic budget cuts. The Army anticipates that it will need to slash $18 billion in spending by the end of this fiscal year on Sept. 30.”


Gun Crime Statistics By US State: Latest Data


How high is gun crime across the US – and which states have the worst figures? This is the latest data
• Get the data
• Click here to explore the interactive map


  We find this current fixation on ” gun murders ” as opposed to ALL murders to be a sad commentary on the state of public debate which  , as we know ,  is driven by a statist-media agenda . It is demeaning to all of us and especially to the multitude of victims killed by other means . 


   We speak from personal experience when we say that focussing on the means instead of the end is a political mechanism geared to disarming us both literally and figuratively . A life taken is a life gone regardless of the method employed .

   Full Disclosure : Editor’s first wife was strangled with her own purse strap while attempting to resist a rapist . Are we to believe that her life and loss of same is somehow less significant than the gangster thug shot down on a street corner in retaliation for a drug deal gone bad ? 


Interactive Crime Data Map


” How bad is gun crime in the US? The latest data from the FBI’s uniform crime reports provides a fascinating picture of the use of firearms in crimes across America.

Barack Obama is under pressure to tighten gun laws after following the disclosure by police that the Newtown gunman used a semi-automatic assault rifle equipped with “numerous” high-capacity magazines holding hundreds of bullets to carry out his massacre of young children.

The US has the highest gun ownership rate in the world – there are 89 guns for every 100 Americans, compared to 6 in England and Wales.

And the murder figures themselves are astounding for Brits used to around 550 murders per year. In 2011 – the latest year for which detailed statistics are available – there were 12,664 murders in the US. Of those, 8,583 were caused by firearms.

The FBI crime statistics are based on reports to FBI bureau and local law enforcement. The figures are not complete – there are no stats for Florida or Alabama on firearm murders. But even so it provides a detailed picture of attacks by state. ”


   Please excuse the brief rant above . While we do not care for this tactic of isolating one type of killing over another because it has proven useful to the statist agenda , we did find this map of interest and are sure that the liberty loving statistician types among our readers might make good use of the map and the other data at the link . Forgive us for getting personal for a moment …


What State Buys The Most Guns?


NICS 95-12

” Four states exceeded one million Federal Bureau of Investigation NICS checks; Kentucky, Texas, California and Illinois. Kentucky is the only state to exceed two million background checks.

Background checks are only a proxy measure for gun sales. A buyer may purchase more than one gun through a gun dealer, depending on the local laws, once the background check comes back authorizing the purchase. ”

State by state NICS checks 2012

NCIS By State

State-Level Job Loss …

… Since the Start of the Recession


  “Employment in ten states is above their pre-recession levels. At 16.7%, North Dakota has, by far, the biggest job growth over this period, with Alaska and Texas growing at 3.4% and 3.0%, respectively.”


Notice anything about the growth states ? A common denominator ? 


A Handy Guide To Early Voting

Conservative Patriots of America


Food Stamp Fraud Explodes when we have ” the Food Stamp President ” ?

“Fraud is skyrocketing as states shift from issuing paper-based food stamps to plastic, electronic benefits transfer cards preloaded with a monthly limit of cash intended only for food purchases.

  Examples of fraud prompted Congress to take action, with President Obama signing a law in February intended to prevent EBT cardholders from spending their money on tattoos and at strip
clubs, liquor stores and casinos.

  Here’s a state-by-state listing of some EBT fraud stories: ”

HT/Instapundit